Making Sense of Fintech Multiples
What the public markets can tell us about venture capital's darling category
Originally published on my Substack December 21, 2020
Last week I noticed three series B announcements totaling over $130M of new capital for fintech companies within my personal network. Three weeks ago, a16z announced that they’d closed $4.5B of new capital commitments for investments in consumer, enterprise, and… financial services technology. It seems as if all the other mega VC funds have dedicated fintech investment teams these days. Along with how much they miss travel and restaurants, the early-growth (series A - series C) investors I speak with on a weekly basis all bemoan the pace and prices at which these financings are happening.

(Above: You will remember this exact dialogue from the movie Zoolander)
Naturally enough this made me wonder how much of premium VCs were paying for early-growth stage companies relative to more mature public comps. So I fired up JupyterLab. What follows is my analysis of valuation trends among the publicly traded stocks in the NASDAQ Fintech Index from Q4 2015 to Q3 2020.
Disclaimer: If you already find this boring I promise it’s not going to get any better.
Fast-growing SaaS business are priced on their forward revenue multiples. This inexact yet robust approach estimates the enterprise value of a business by multiplying next year’s revenue by the forward multiple. While fintechs have characteristic differences from pure SaaS companies (generally slower growth, higher regulatory hurdles, narrower margins, and stickier contracts), they can be valued using this methodology.
Determining which revenue number to use for analysis can be somewhat subjective and always involves compromise. Using trailing twelve month revenue (TTM), is convenient because (1) it’s the ground truth and (2) it’s always up to date but is seriously limited when companies are growing quickly and have significant revenue contracted in advance. Another approach is to use the subsequent year’s actual revenue number, though of course that means any analysis is always a year late.
Arguably the best approach is to use a consensus estimate. That said, the question becomes, who’s estimate? For the sake of time and expense, my projections are derived by taking the company’s three-year average revenue growth and multiplying it by 80% to generate a prediction for next year. This works surprisingly well (at least compared to Zacks earnings estimates).
Pandas makes it easy to use all three approaches which is what I’ve done in the interest of thoroughness. The results are quite similar with modest differences in scale.
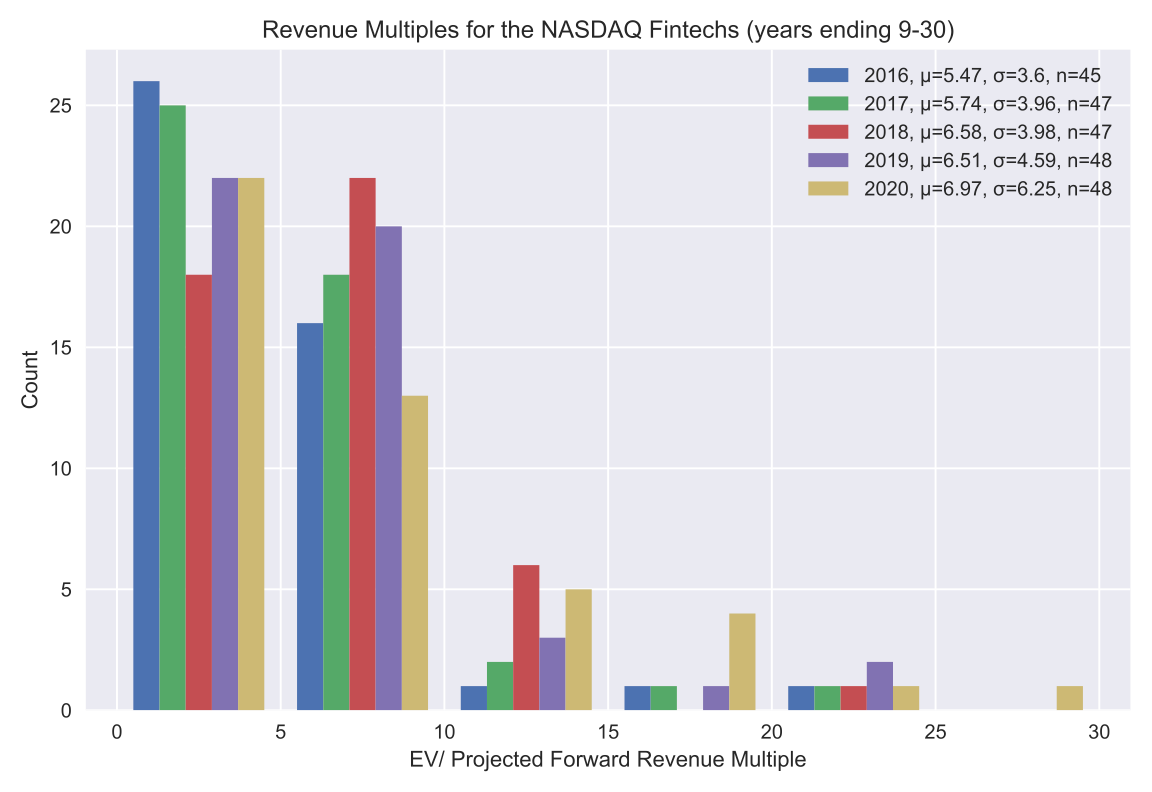
The histogram above shows the number of companies in the NASDAQ Fintech index who’s forward multiples fall into the buckets on the x-axis. The legend includes the average forward multiple and standard deviation for each year denoted by the Greeks mu and sigma respectively. The lowercase n in the legend refers to the number of stocks that we have data on for that time interval. The chart shows a mild but definite trend toward higher multiples from the period ending on September 30, 2016 to September 30, 2020 (this may not exactly qualify as a profound revelation). You may also notice that the average public fintech multiple is less than half the average SaaS multiple.
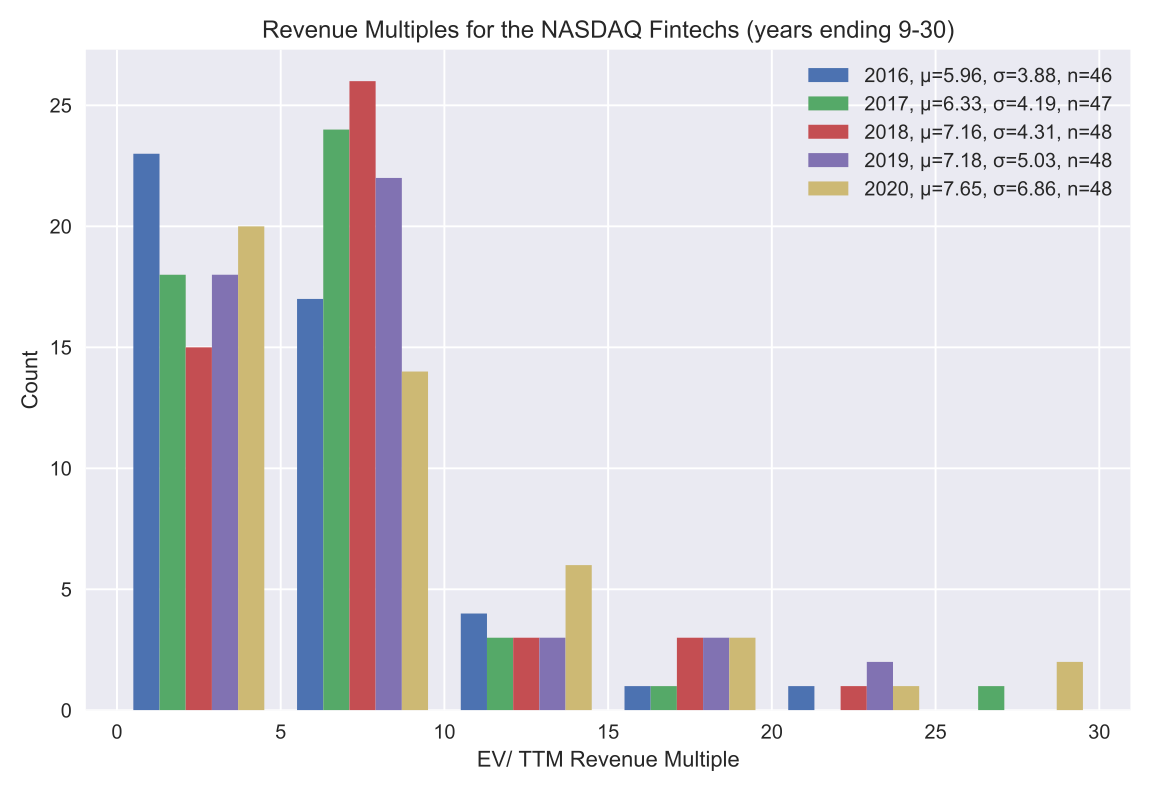
Above, I’ve included the same graph but using TTM revenue instead of my projection. There is the same modest trend towards higher multiples with an appreciable uptick in the past year. Naturally, implied multiples are higher using this methodology as TTM does not include next year’s growth expectations.
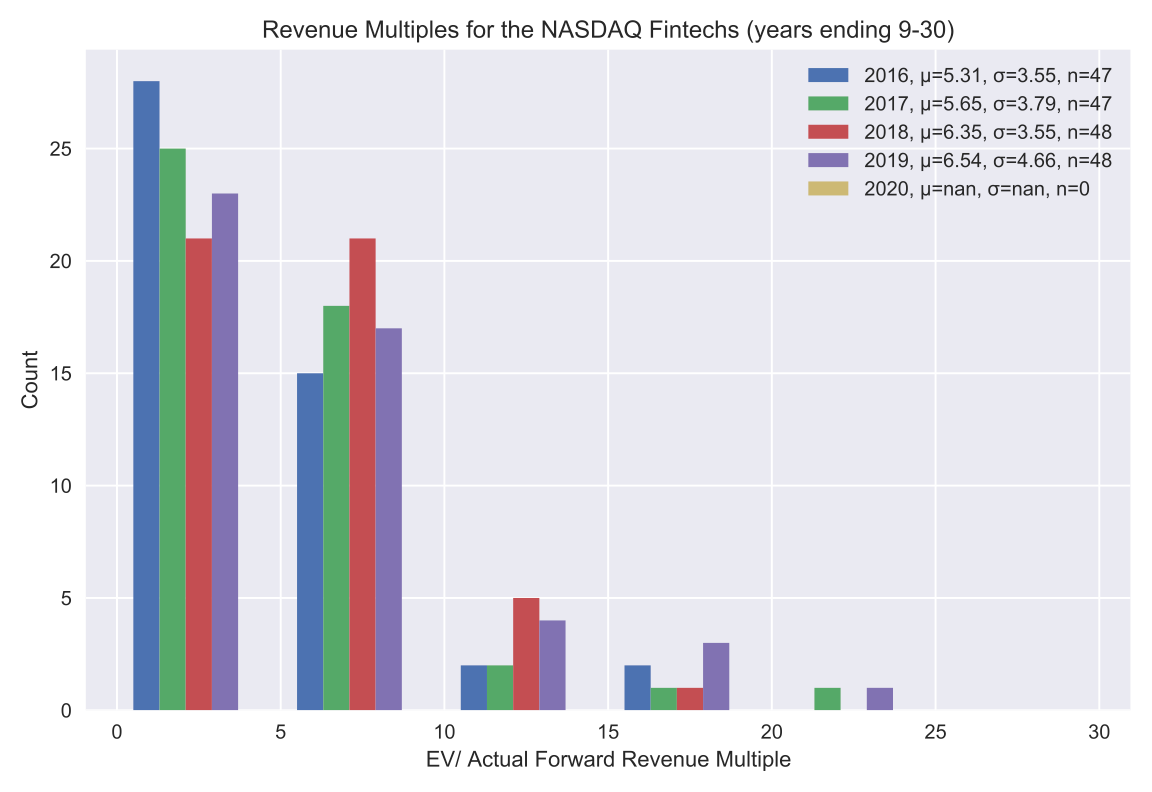
For those like me who start panting when you shift the time index in a spreadsheet for backtesting, I’ve included the same graph but using the subsequent year’s actual revenue. It turns out that up until 2018, public fintechs consistently exceeded growth expectations. Last year, expectations matched actual growth (could we be reaching an inflection point?). Of course, I don’t know what actual revenue will be from Q4 2020 to Q3 2021 but I would expect the upward trend to persist, especially if we’ve reached the point in the cycle where earnings are going to stop beating expectations.
Tl;dr: fintech is hot, it’s never been this hot, it might not get any hotter, and fintech revenue is not as valuable as SaaS revenue Q.E.D.
Ceteris Peribus, companies with higher growth rates and better margins should command a higher forward multiples. “All things being equal” is not consistent with the world as I have found it so I did some more empirical work.
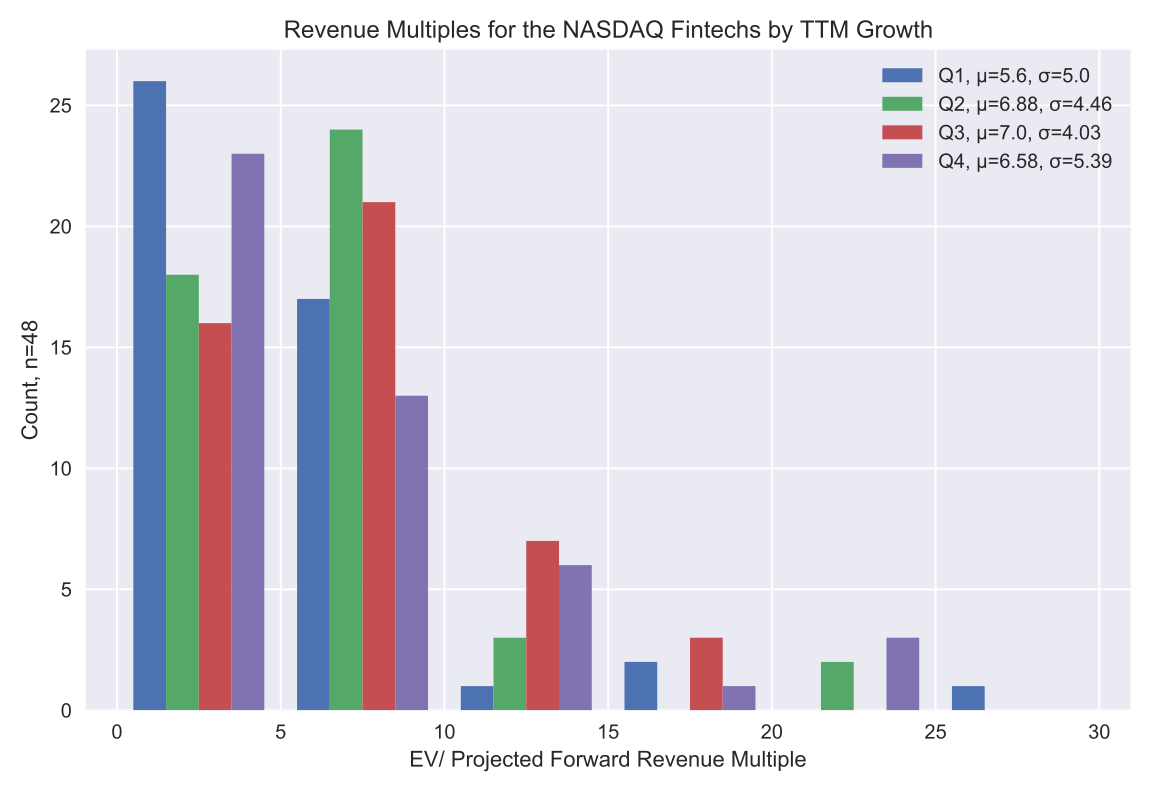
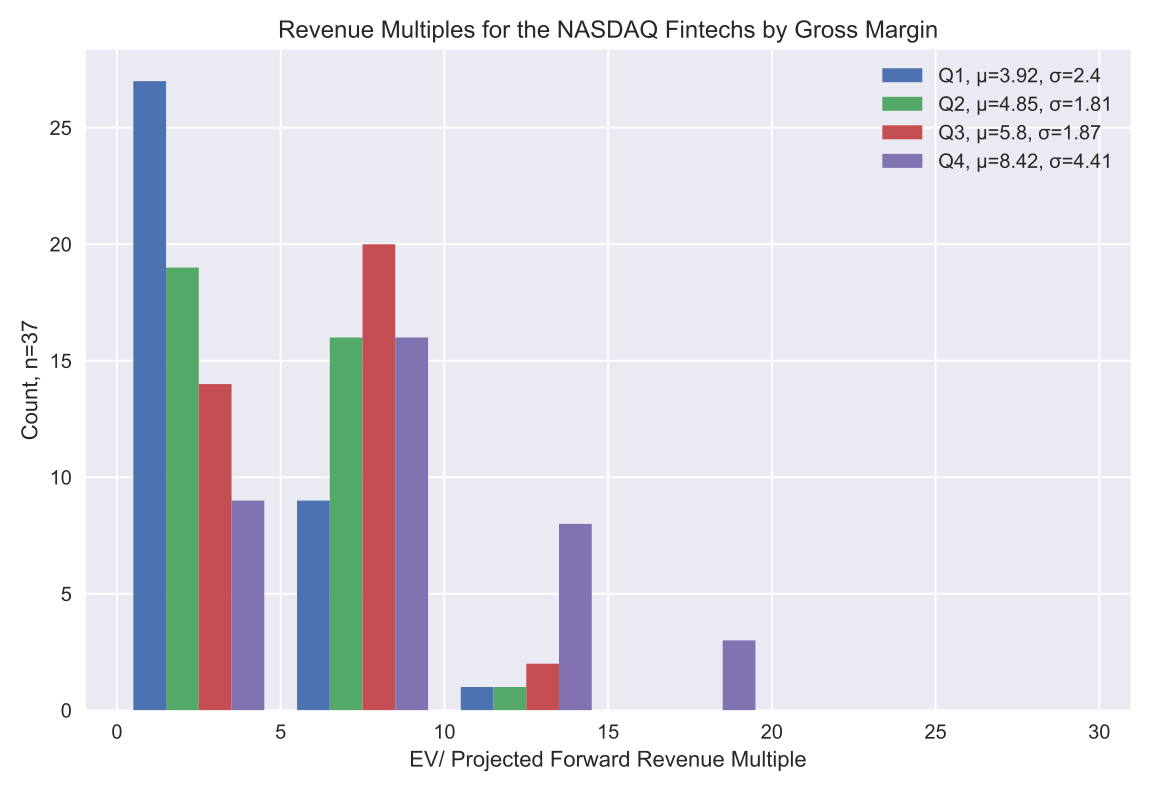
In the chart above, I grouped the observations into quartiles by TTM revenue growth and then counted them into the revenue multiple buckets on the x-axis. The legend includes the average forward multiples and standard deviation for each quartile. The legend and chart tell a murky, if discernible story, faster growing fintechs are worth a little bit more, sometimes?
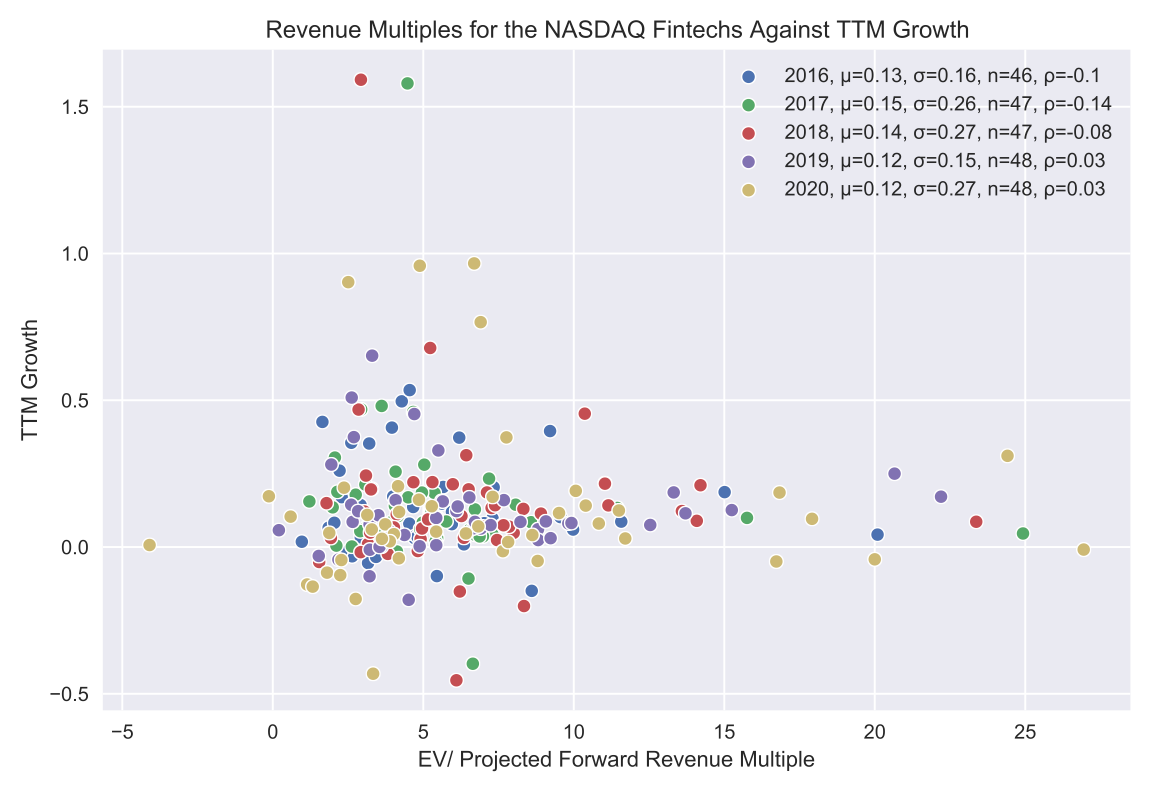
I struggled to accept that the relationship was so weak, so I plotted the projected forward revenue multiples against TTM growth. In the chart above, I also include the correlation between TTM growth and the revenue multiple denoted by the Greek rho in the legend.
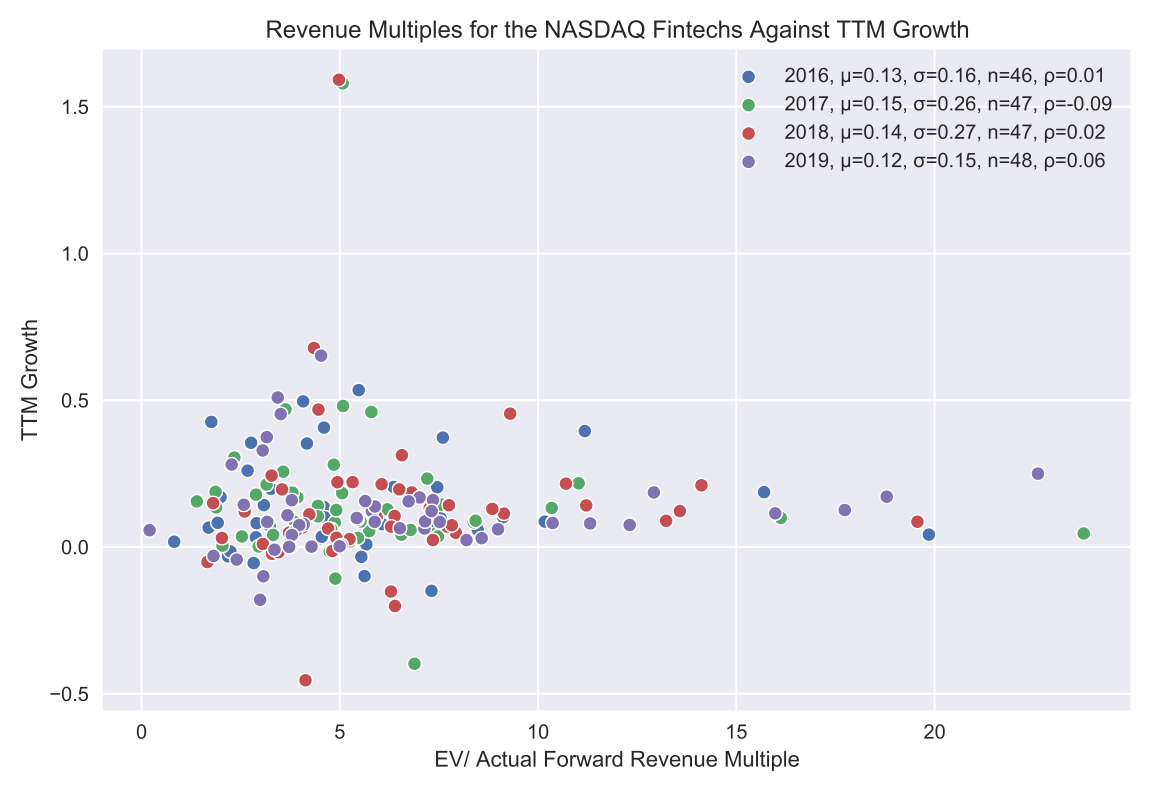
It then occurred to me that perhaps my simplified revenue projection was throwing noise into the relationship so I plotted TTM growth against the actual forward revenue multiple; the relationship is even weaker! Conclusion: the log difference in annual revenue is too unstable a parameter to show a persistent relationship.
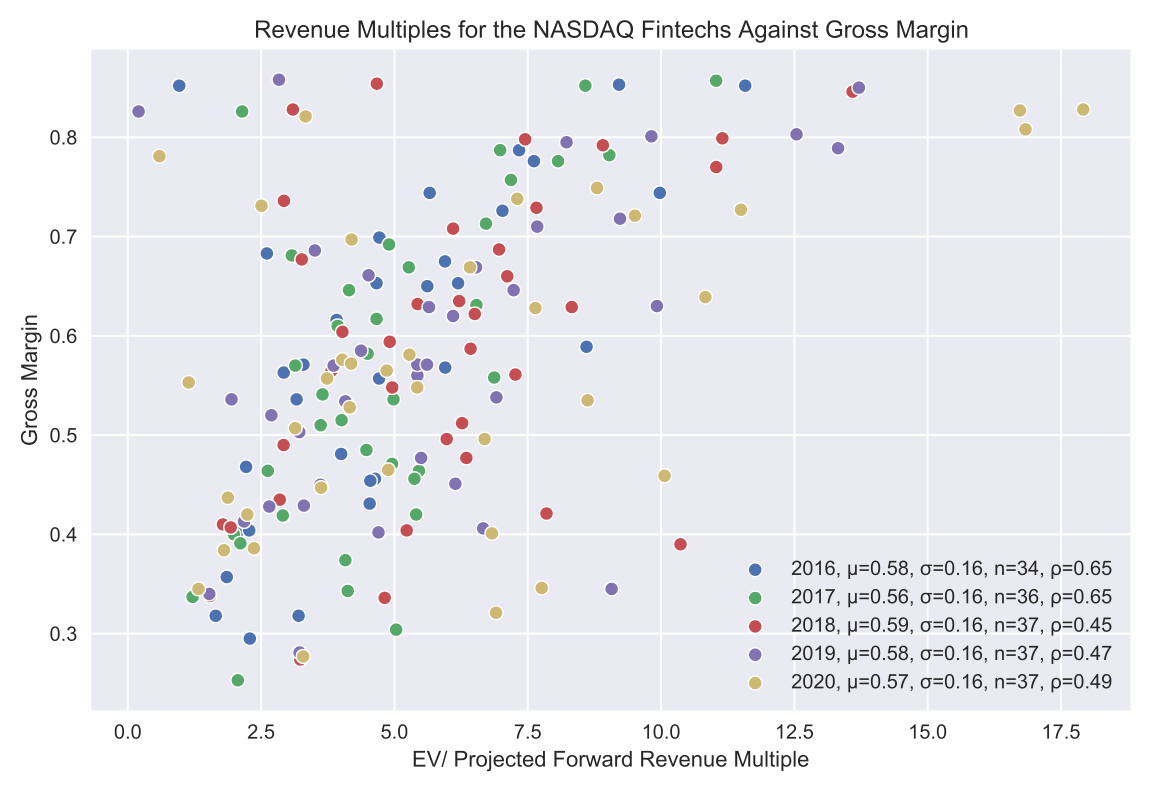
My suspicion that higher gross margins would be related to higher forward multiples matches the data. Unfortunately, not all public fintechs report COGS so our data set is less complete (we lose more than 50 observations relative to our other metrics). The scatter plot below illuminates the relationship. You will also observe that on average, fintechs are sub-60% gross margin businesses.
Thus, we arrive at our final and most interesting financial metric when it comes to estimating forward multiples: cash flow margin. This isn’t surprising as it’s a decent proxy for sales efficiency which is a hugely important determinant in pure-SaaS multiples. In fact, looking at cash flow margins may be an effective way to determine the “SaaSy-ness” of a fintech company. Top quartile fintechs by cash flow margins command a greater than 10x forward multiple on average (that is classic public SaaS multiple territory). Bottom quartile cash flow margins translate to a sub-4x revenue multiple (where Apple traditionally resides) with an extremely low standard deviation (or rather with high certainty). Another nice feature of this financial ratio is that public fintechs report on this consistently giving this result additional ballast.
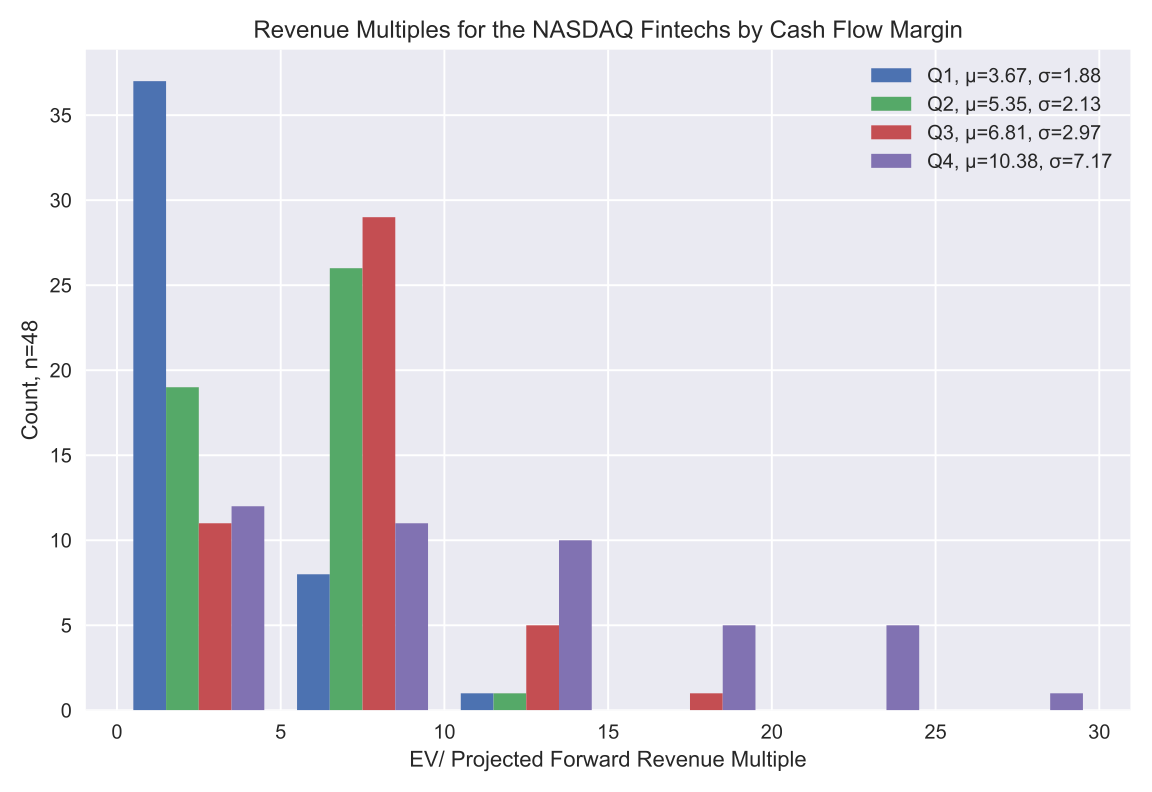
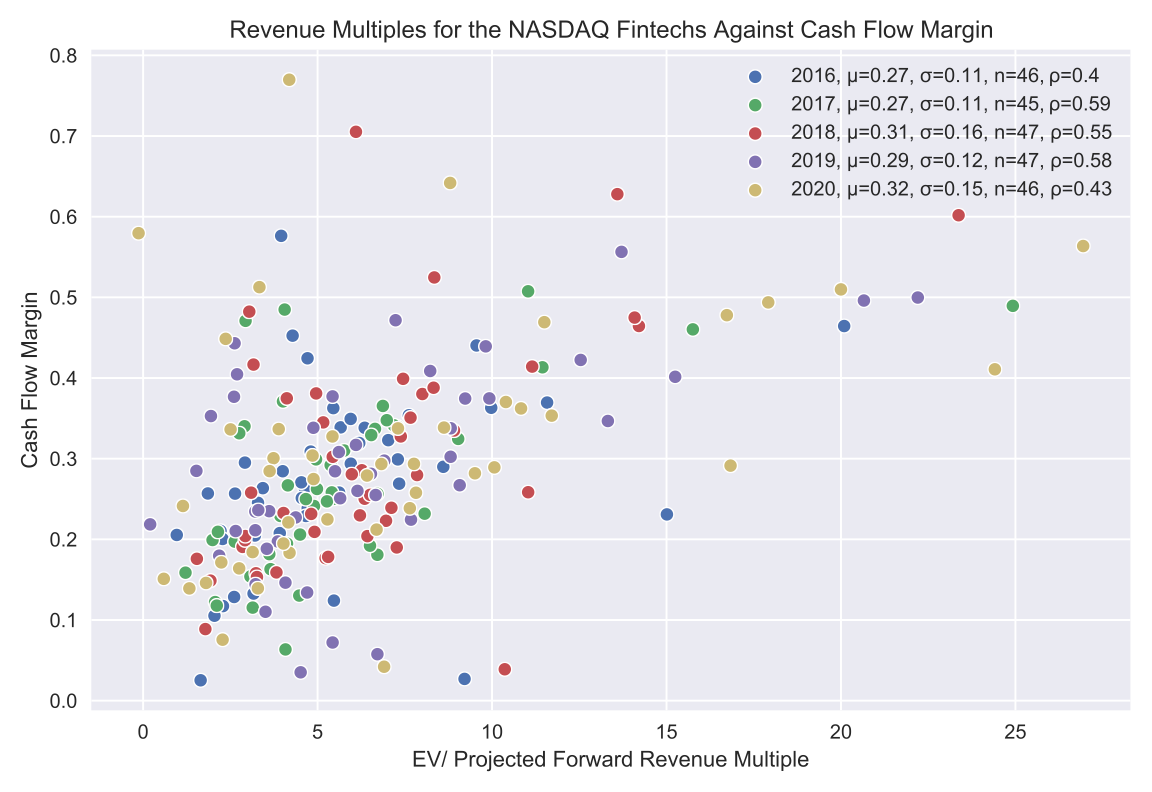
For completeness, I plotted forward multiples against cash flow margins below. You can see the strong relationship and consistent 30% average cash flow margin across fintechs over the last five years. Cash flow margins above 35% are top quartile for these companies.
So, assuming that these early-growth stage fintech companies have top quartile growth and “SaaSy” margins, we can expect them to be valued at roughly 10x forward revenue when they go public. I’m sure that all of these hot fintech rounds are happening at a significantly higher multiples which means these companies better grow to justify continued funding rounds at higher valuations.
For SaaS investors who have fallen for fintech, a word of caution, make sure you’re buying software margins for softwares prices and remember: “SaaS and fintech are not the same ‘ting [thing].”