Wag the Dog

Interpreting value at the intersection of technology and insurance
Originally published on my Substack March 10, 2021
I was recently asked to appear on a panel where I was told I would be asked about the fintech IPO market and what (if anything) public valuations had to teach us private markets investors. Prudence dictated that I do some research.
What follows reflects market prices from the week of February 15th, 2021.
As I write, the four most recent fintech IPOs are Rocket Companies (RKT), Shift4 Payments (FOUR), Affirm (AFRM), and of course Lemonade (LMND). Having previously conducted a fairly thorough investigation of older publicly traded fintechs, I was surprised by what I found.
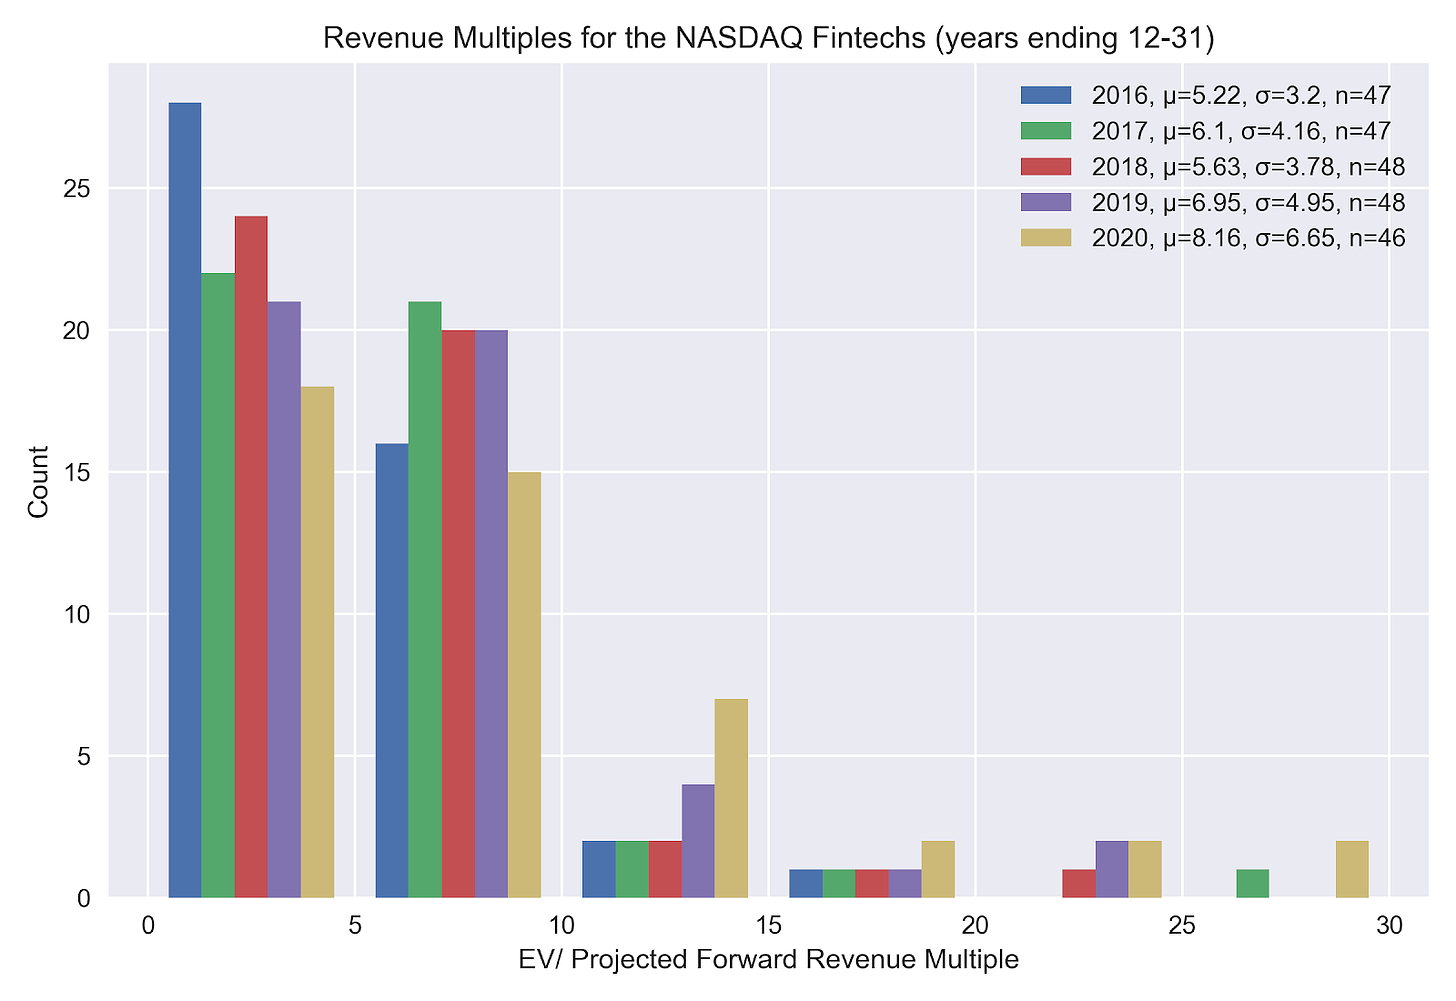
The histogram above may be new to some of you and shows the count of companies in the NASDAQ Fintech Index who’s forward multiple falls into the buckets on the x-axis. The legend includes the average forward multiple and standard deviation for each year denoted by the Greeks mu and sigma respectively. The Latin n in the legend refers to the number of stocks that we have data on for that time interval. While there is an observable (and accelerating) trend towards higher multiples (and higher dispersion) over the last five years, the average fintech multiple is roughly half that of the average SaaS business. The highest forward multiple in this cohort is still less than thirty. But that could change.
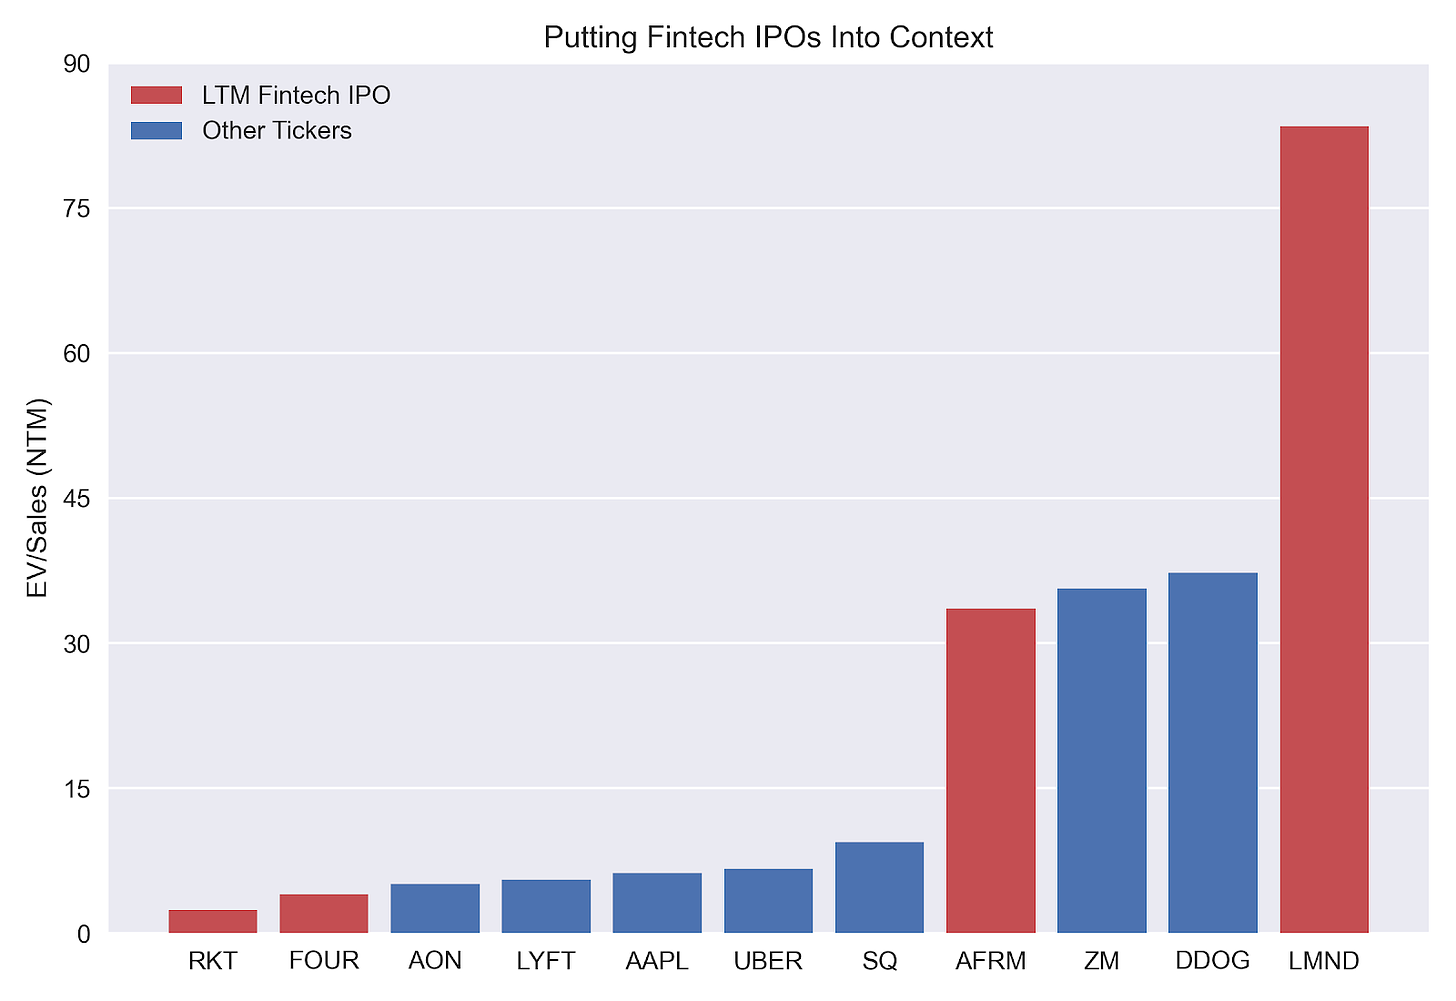
The bar chart above shows forward multiples for the four recent fintech IPOs (highlighted in red) and several other tickers for context in blue (from left to right: Aon, Lyft, Apple, Uber, Square, Zoom, Datadog). Lemonade trades at over eighty-times forward revenue more than double the multiple for pure software businesses Zoom and Datadog. Less remarkably (though still astounding) is Affirm’s 30x revenue multiple.
Aren’t these balance sheet businesses?
Sort of, Lemonade reinsures more than 75% of their book which materially decreases their cost of capital but it's not a free lunch. The Company has yet to prove that they can sustainably use their reinsurance partners as growth capital (Lemonade’s reinsurance narrative is controversial and I would encourage readers to seek out other authors’ work on this specific topic).
Puzzled though I was, I had not looked at the data surrounding what people pay for insurance companies. Top-line growth is extremely valuable to high-margin tech companies, what about in insurance? For my analysis, I chose twenty-seven of the largest public insurers (tickers: CB, AON, MET, AIG, MMC, PGR, PRU, WLTW, TRV, ALL, AFL, AJG, HIG, ACGL, PFG, LNC, MKL, CINF, BRO, CNA, WRB, FNF, GL, RNR, RE, RGA, UNM).
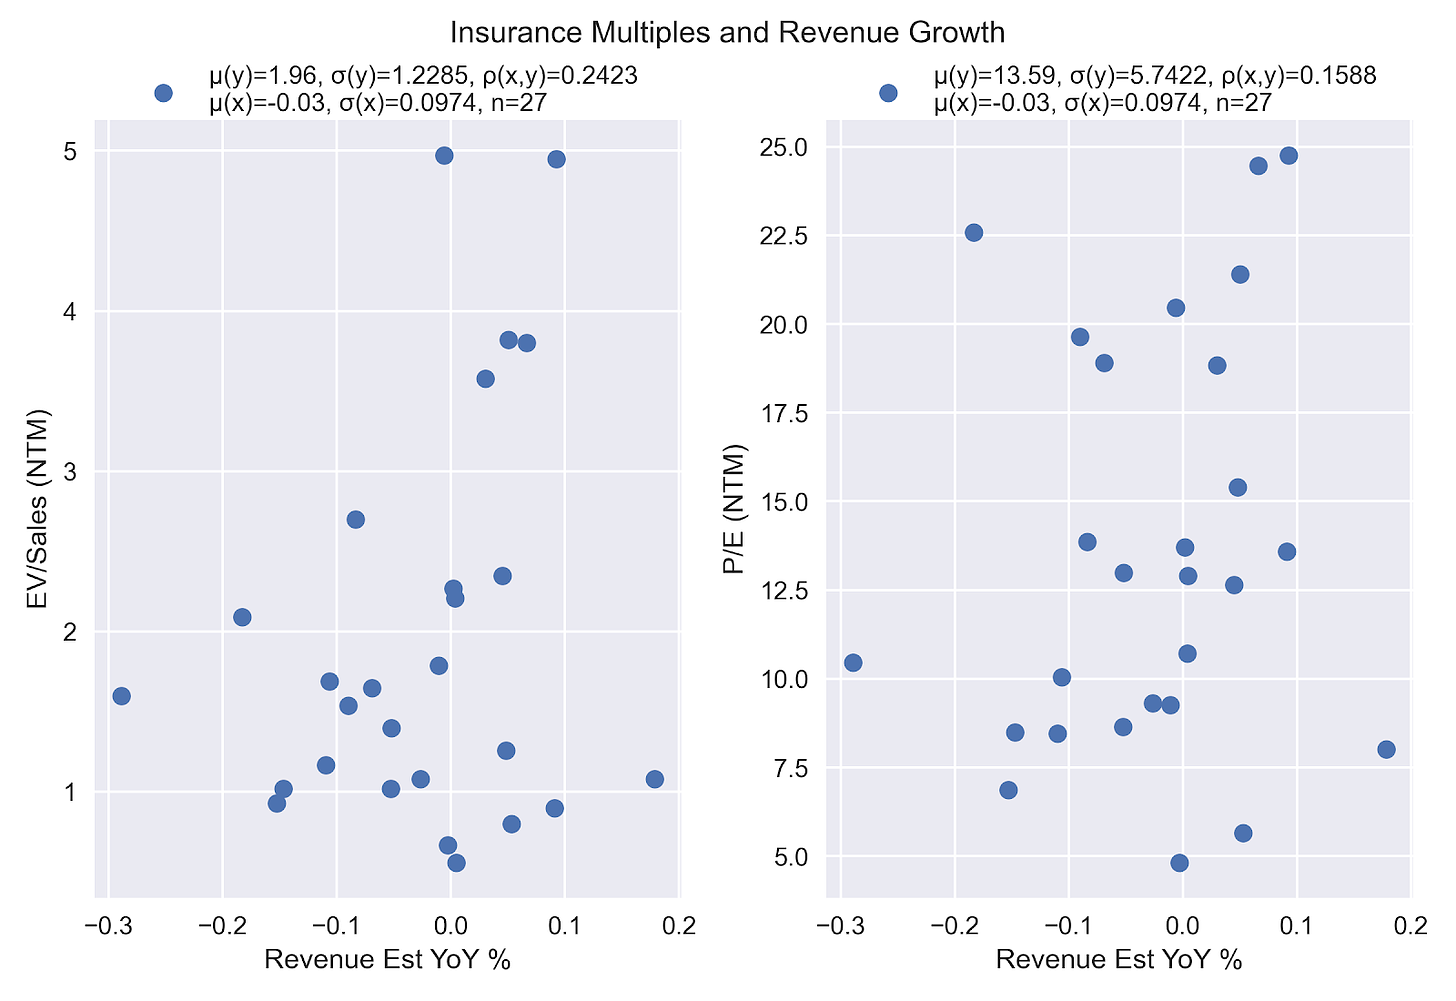
I plotted the relationship between revenue growth and forward revenue multiples and between revenue growth and earnings multiples respectively. The Greek mu denotes the mean function (mu(y) is the mean of the observations corresponding to the y axis), sigma the standard deviation, rho the correlation coefficient, and the Latin n the number of observations. There’s no persistent relationship here which isn’t surprising given how challenging profitable growth is to achieve (as Lemonade’s historical loss ratios attest).
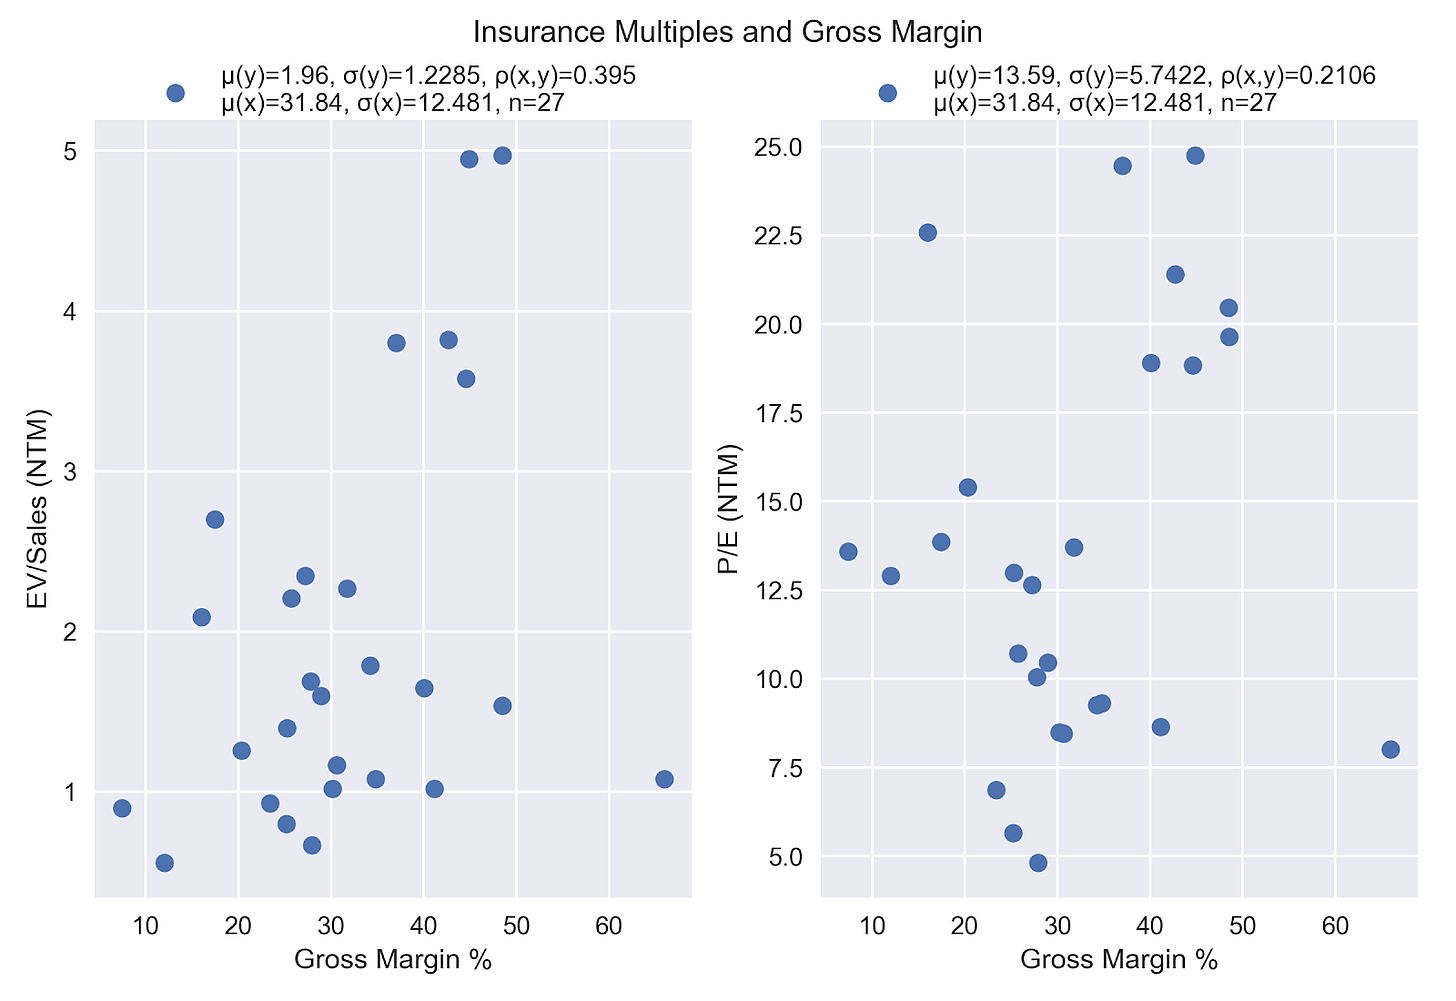
I completed the same exercise for gross margin and while it looks like there’s some relationship to enterprise value, what’s interesting is that at 37%, Lemonade doesn’t stand out as any different from its legacy peers.
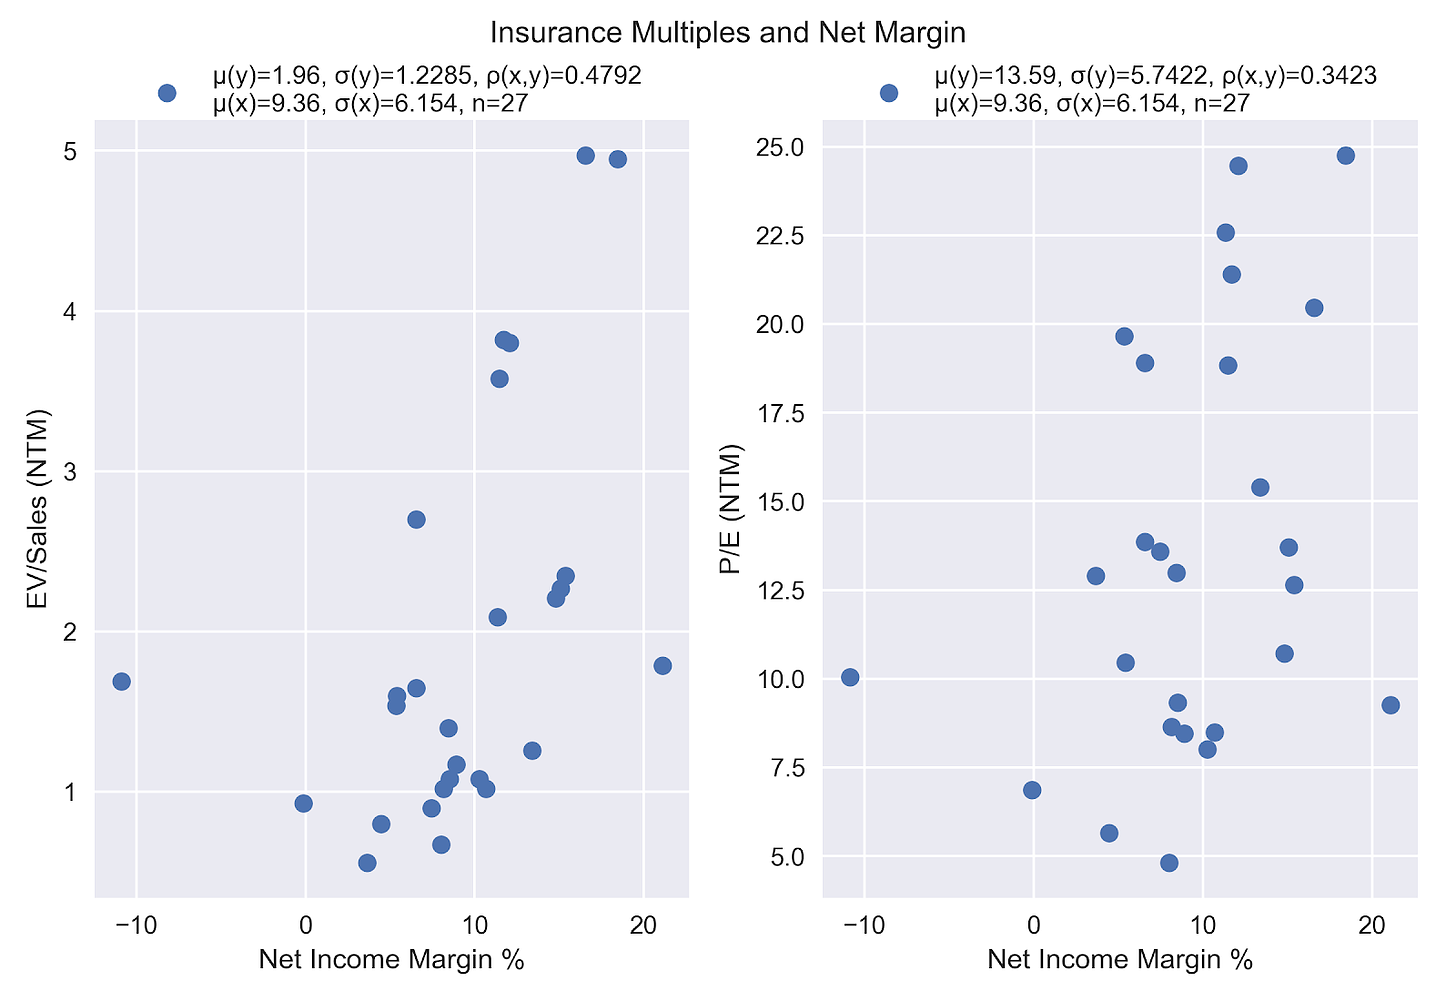
Net income margin has the strongest relationship to enterprise value in the insurance sector. While potentially heretical in venture circles, profitable businesses are worth more in some sectors. Lemonade’s net income margin is less than -124% (for what it’s worth, but I don’t read anything into that number other than the sign).
Lacking a fundamental explanation for Lemonade’s rich multiple, I was curious to learn what the distribution of valuations across the industry as a whole might look like. How much does lemonade need to grow to justify its current price (or how much might that price need to come down to align with historicals)?
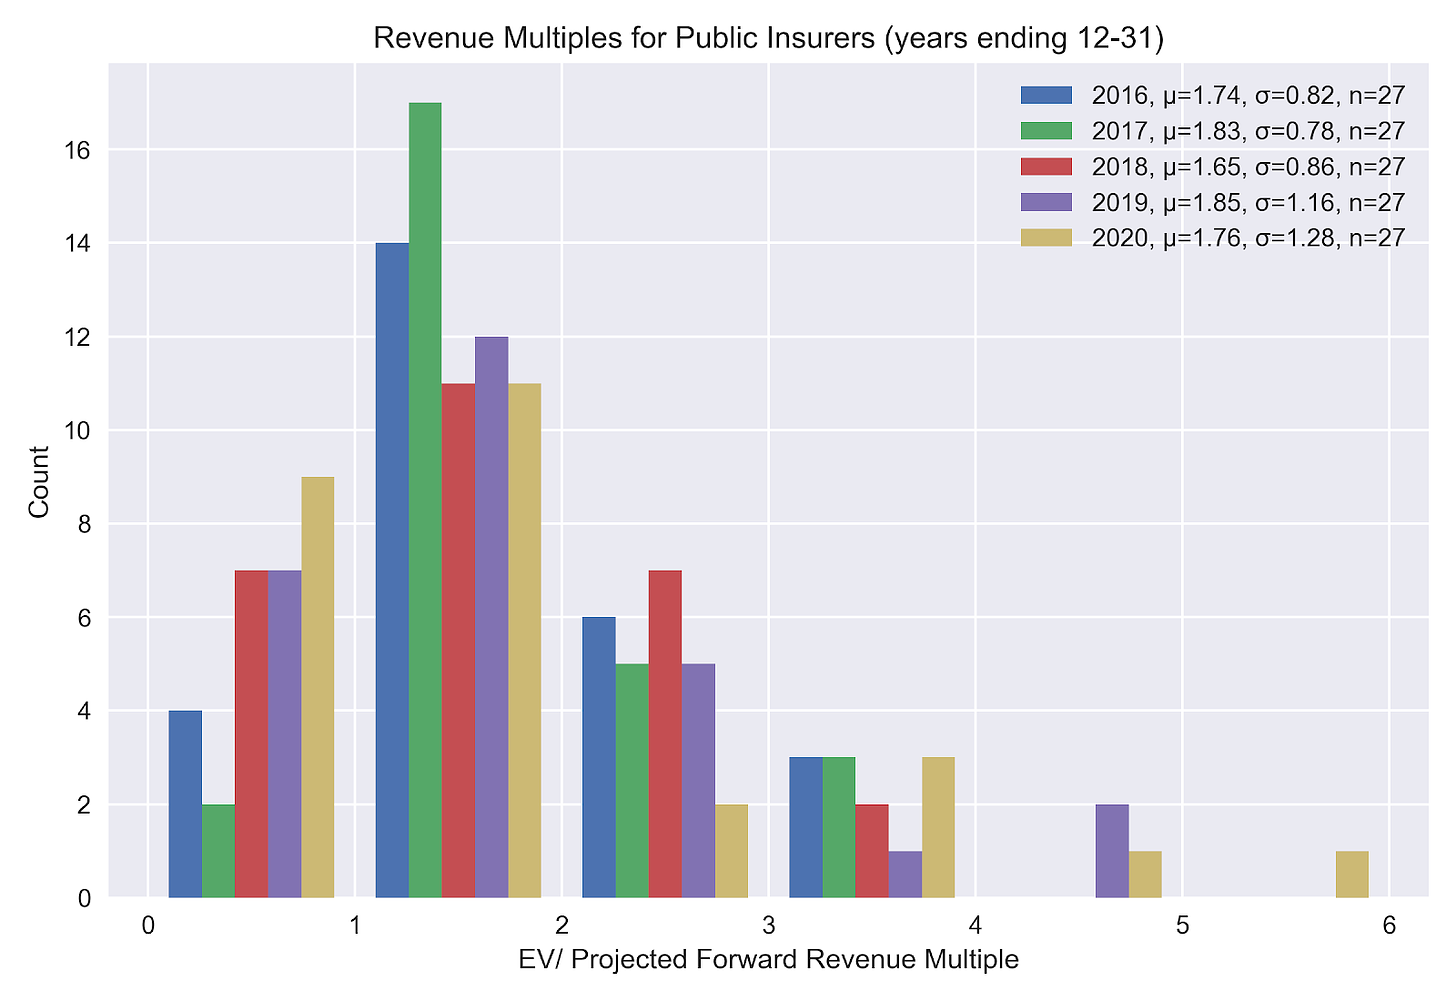
Insurance companies trade in a very narrow range and the market’s appetite for them is by no means increasing.
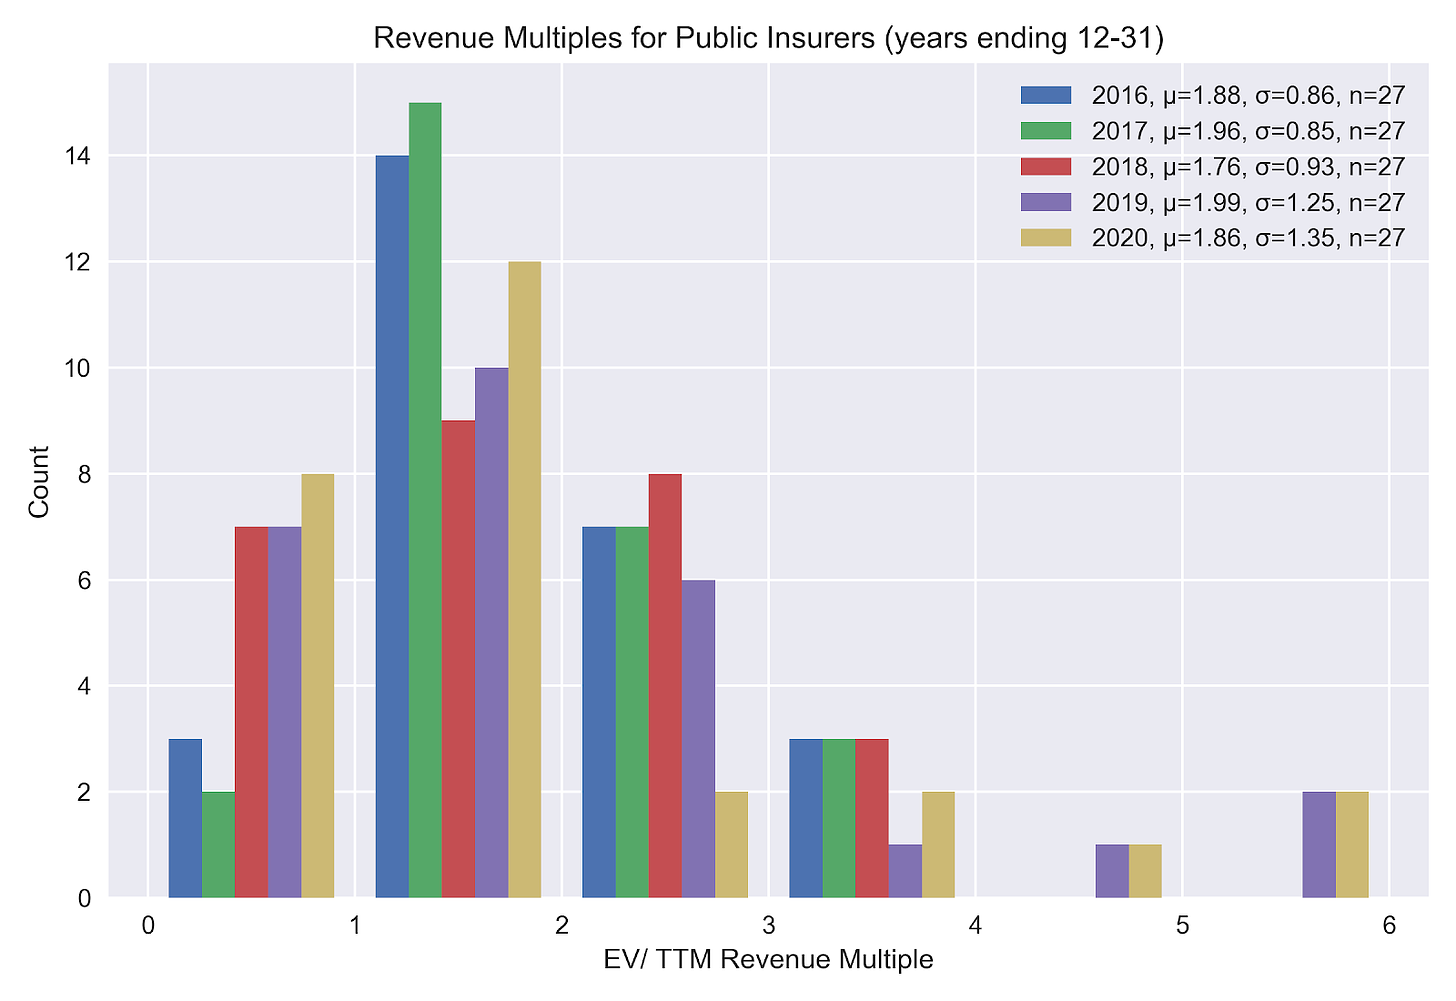
Trailing multiples tell the same story.
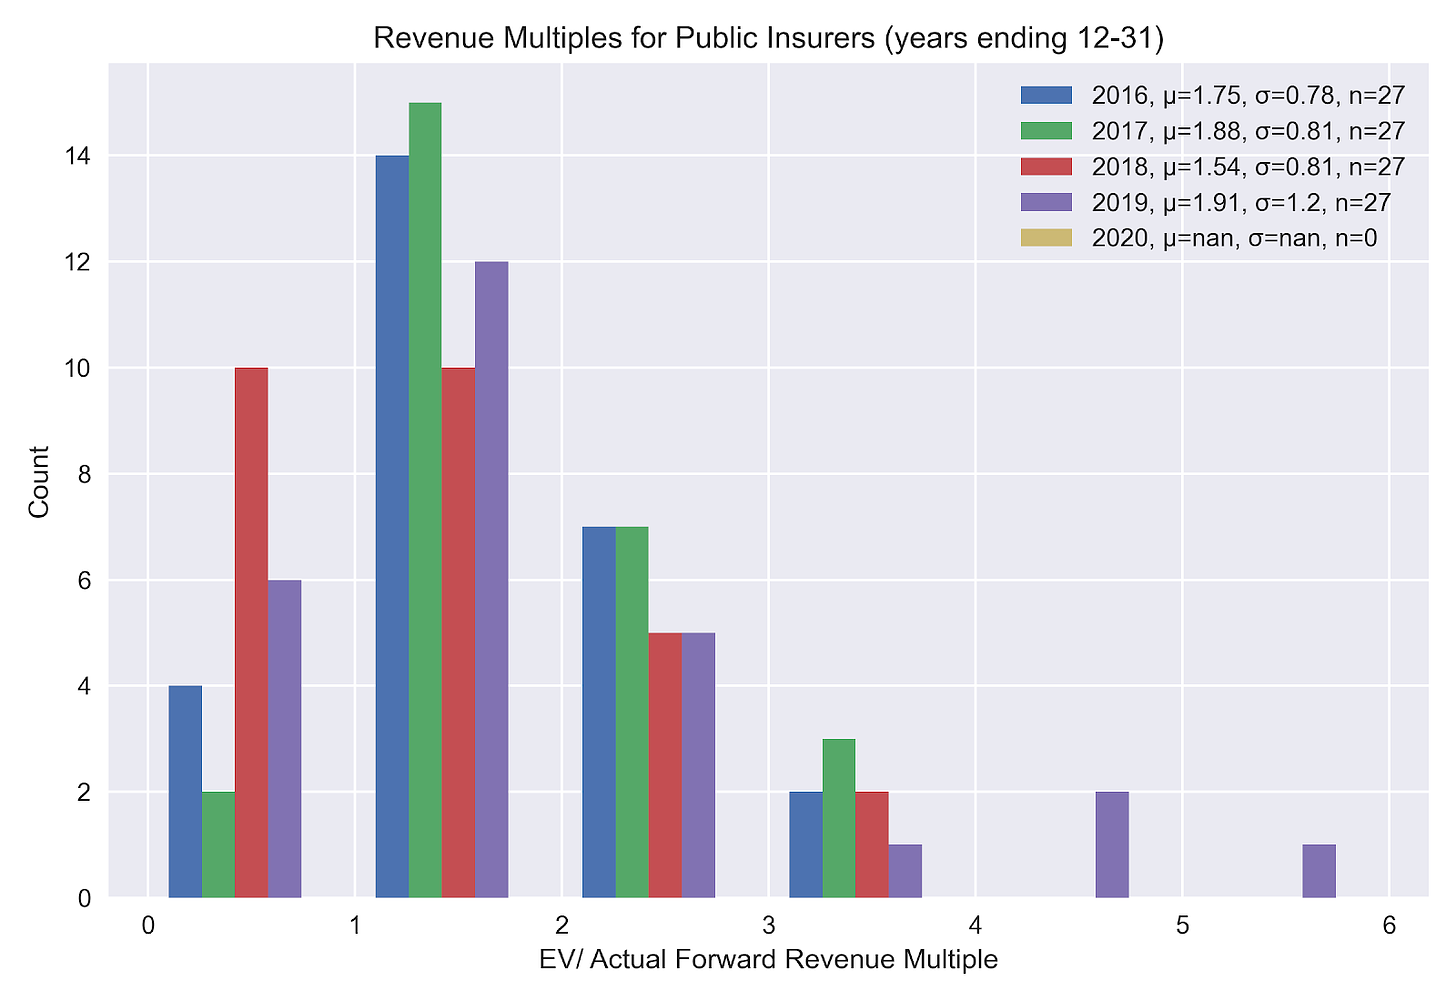
And so does the true forward multiple (we have no observations for 2020 as we don’t know what 2021 revenues are yet).
Of this cohort, Aon has the highest multiple at roughly 5.3x next year’s sales. If Lemonade traded at Aon’s multiple, their current valuation would imply $960 million in sales next year, over eight-times today’s forecast.
Okay, yes, that is a hyperbolic comparison. Lemonade is an extremely innovative company with a technology-first business model and a bleeding edge digital distribution strategy. So is Square, which has less than a nine-times forward multiple, and is growing at more than 100% annually, and the CEO is a guy called Jack Dorsey. On that basis, Lemonade would have to increase next year’s sales five-fold. But I digress.
So, what do public markets tell me as a venture capitalist?
First of all, while price discovery might be better in a liquid market than in a single agreement between a team of professional investors and a technology company, maybe not always?
Second, invest in startups that help other insurance companies be more like Lemonade. I won’t restate the case for vertical SaaS / robotic process automation here but this is part of the reason we’re proud investors in towerIQ and Roots Automation
Lastly, the monetary experiment we’ve been participating in for the last decade has poured cash onto corporate balance sheets, not into the pockets of consumers. Consumer fintech is uniquely challenging at the best of times; I expect enterprise to continue to outperform.
So in the meantime, “I’m following the money.” -Lester Freamon